系统迁移中,暂时无法访问,所有数据会迁移到新的网站。
OpenMV VSCode 扩展发布了,在插件市场直接搜索OpenMV就可以安装
如果有产品硬件故障问题,比如无法开机,论坛很难解决。可以直接找售后维修。
发帖子之前,请确认看过所有的视频教程,https://singtown.com/learn/ 和所有的上手教程http://book.openmv.cc/
每一个新的提问,单独发一个新帖子
帖子需要目的,你要做什么?
如果涉及代码,需要报错提示与全部代码文本,请注意不要贴代码图片
必看:玩转星瞳论坛了解一下图片上传,代码格式等问题。
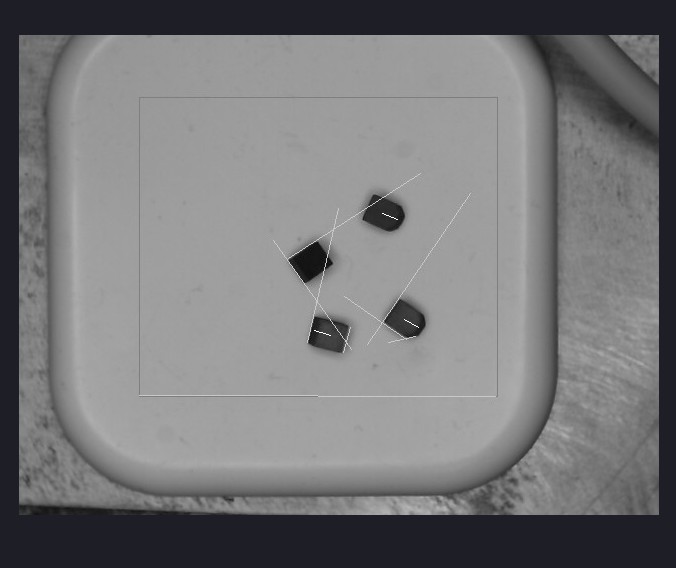
线段识别问题:在图像上画一条直线之后识别这条直线,设置阈值为什么没有作用?
-
thresholds = (35, 79) sensor.reset() sensor.set_pixformat(sensor.GRAYSCALE) sensor.set_framesize(sensor.VGA) sensor.skip_frames(time = 2000) sensor.set_auto_gain(False) # must be turned off for color tracking sensor.set_auto_whitebal(False) # must be turned off for color tracking clock = time.clock() # Only blobs that with more pixels than "pixel_threshold" and more area than "area_threshold" are # returned by "find_blobs" below. Change "pixels_threshold" and "area_threshold" if you change the # camera resolution. "merge=True" merges all overlapping blobs in the image. while(True): i=0 # 定义变量i,色块个数 thresholds = (35, 79)#第一次查找阈值 clock.tick() img = sensor.snapshot() for blob in img.find_blobs([thresholds],roi = [120,62,359,300], pixels_threshold=300, area_threshold=100, merge=True):#pixels像素个数阈值,area返回色块边框面积阈值(w * h),merge=True多种颜色时显示一个框框 img.draw_rectangle(120,62, 359, 300, color=127)# 在图像上绘制ROI区域 # These values depend on the blob not being circular - otherwise they will be shaky. if blob.elongation() > 0.5: #img.draw_edges(blob.min_corners(), color=255)# 返回的角列表之间绘制线边 img.draw_line(blob.major_axis_line(), color=153)# 返回blob的主轴(这条线穿过最小面积矩形的最长边)的行元组(x1, y1, x2, y2),可以使用 image.draw_line() 来绘制它。 #img.draw_line(blob.minor_axis_line(), color=0)#返回blob的次轴(这条线穿过最小面积矩形的最短边)的行元组(x1, y1, x2, y2),可以使用 image.draw_line() 来绘制它。 print('I长比 %s'%blob.elongation) # These values are stable all the time. #img.draw_rectangle(blob.rect(), color=200)# 在图像上绘制一个矩形。 您可以单独传递x,y,w,h或作为元组(x,y,w,h)传递。 #img.draw_cross(blob.cx(), blob.cy(), color=227)# 在图像上绘制一个十字 # Note - the blob rotation is unique to 0-180 only. #img.draw_keypoints([(blob.cx(), blob.cy(), int(math.degrees(blob.rotation())))], size=40, color=1) #绘制圆,size 控制特征点的大小,将 fill 设置为True以填充特征点, #print(blob.cx())#逐个打印色块中心坐标 #print(blob.cy())# #print('框高%s'%blob.h())#打印刀头高度 #在特定roi找到坡口中心位置 shang =0 # blob.x() blob.y() 宽blob.w() 高blob.h() xia = 0 zuo = 0 you = 0 shang = blob.x()-5 zuo = blob.y()-5 xia = blob.h()+5+5 you = blob.w()+5+5 #print('框xia %s'%xia) #print('框shang %s'%shang) #print('框X %s'%blob.x()) #print('框y %s'%blob.y()) k=0 # 定义变量k thresholds = (0, 39)# 第二次筛选阈值 i——cx = blob.cx() i——cy = blob.cy() for blob in img.find_blobs([thresholds],roi = [shang,zuo,you,xia], pixels_threshold=75, area_threshold=10, merge=True):#pixels像素个数阈值,area返回色块边框面积阈值(w * h),merge=True多种颜色时显示一个框框 #img.draw_rectangle(shang,zuo,you,xia, color=15) # 在图像上绘制第二次ROI区域 #if blob.elongation() > 0.5:#越像圆,这个值越小,越不像圆,这个值越大。 #img.draw_edges(blob.min_corners(), color=255)# 返回的角列表之间绘制线边 #img.draw_line(blob.major_axis_line(), color=233)# 返回blob的主轴(这条线穿过最小面积矩形的最长边)的行元组(x1, y1, x2, y2),可以使用 image.draw_line() 来绘制它。 #img.draw_rectangle(blob.rect(), color=227)# 在图像上绘制一个矩形。 您可以单独传递x,y,w,h或作为元组(x,y,w,h)传递。 #img.draw_cross(blob.cx(), blob.cy(), color=227)# 在图像上绘制一个十字 k=k+1 k——cx = blob.cx() k——cy = blob.cy() i=i+1 # 每个色块加1 #print('k数量 %s'%k) # k色块个数 #过滤掉距离近的 #在坡口中心至刀头中心画一条直线 img.draw_line((k——cx, k——cy, i——cx, i——cy))# 画白线 #img.draw_line((80, 50, 100, 100), color=(255,0,0))# 画红线 #确定线的朝向/角度 thresholds = (200, 255) # 第三次筛选阈值 #img = sensor.snapshot() j = 0 # 定义线段数量 #if enable_lens_corr: img.lens_corr(1.8) # 镜头畸变矫正 for l in img.find_line_segments( roi = [120,62,359,300], merge_distance=-5, max_theta_difference=-5):#`threshold`控制从霍夫变换中监测到的直线。只返回大于或等于阈值的直线 img.draw_line(l.line(), color=200) #img.draw_line(x0, y0, x1, y1[, color[, thickness=1]]) j += 1 #print('打印l %s'%l) print('线段数量 %s'%j) ```
-

-
请大神指教,怎样识别物体上画出的白色线段
-
可以识别:
enable_lens_corr = False # turn on for straighter lines...

import sensor, image, time

sensor.reset()
sensor.set_pixformat(sensor.RGB565) # grayscale is faster
sensor.set_framesize(sensor.QQVGA)
sensor.skip_frames(time = 2000)
clock = time.clock()

# All lines also have `x1()`, `y1()`, `x2()`, and `y2()` methods to get their end-points
# and a `line()` method to get all the above as one 4 value tuple for `draw_line()`.

while(True):
    clock.tick()
    img = sensor.snapshot()
    if enable_lens_corr: img.lens_corr(1.8) # for 2.8mm lens...

    # `merge_distance` controls the merging of nearby lines. At 0 (the default), no
    # merging is done. At 1, any line 1 pixel away from another is merged... and so
    # on as you increase this value. You may wish to merge lines as line segment
    # detection produces a lot of line segment results.

    # `max_theta_diff` controls the maximum amount of rotation difference between
    # any two lines about to be merged. The default setting allows for 15 degrees.

    img.draw_line(10,10,100,100,(0,0,0))


    for l in img.find_line_segments(merge_distance = 0, max_theta_diff = 5):
        img.draw_line(l.line(), color = (255, 0, 0))
        # print(l)

    print("FPS %f" % clock.fps())
另外你识别你画的直线做什么?这是已知的啊。