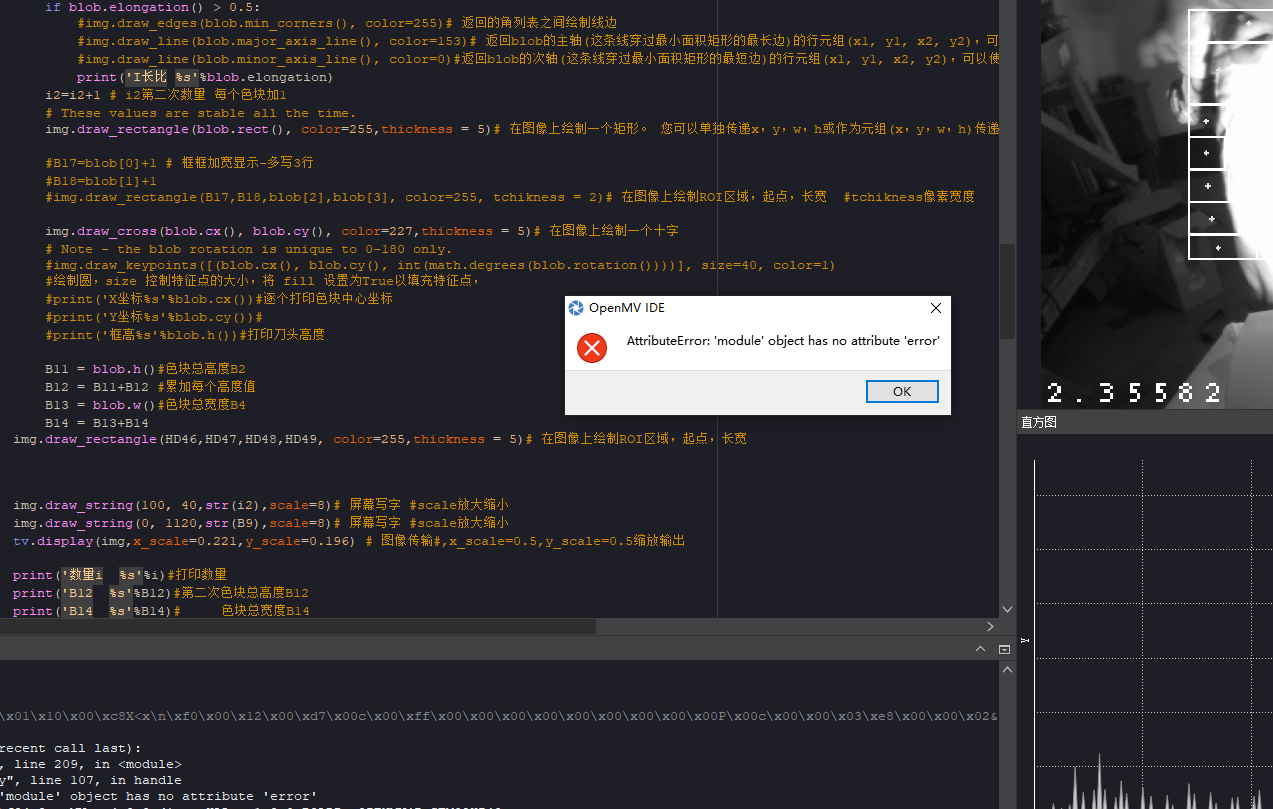
运行几分钟就会报这个错误(module object has no attribute error)
import sensor, image, time, math, tv ##- 周一 5月 1 2023
from pyb import UART # 导入串口
from modbus import ModbusRTU # 导入ModbusRTU的类
uart = UART(3,9600, parity=None, stop=1, timeout=2, timeout_char=1) # 串口3,波特率,效验,停止位
modbus = ModbusRTU(uart, register_num=9999) # 实例一个Modbus对象

sensor.reset()
sensor.set_pixformat(sensor.GRAYSCALE)
sensor.set_framesize(sensor.UXGA)# WQXGA 2592*1944 #300万QXGA2048*1536 #190万UXGA1600*1200  #70万XGA1024*768  #SVGA800*600 #VGA640*480 #QVGA 320*240   #QQVGA 160*120
# sensor.set_hmirror(True) #图像水平反转
sensor.set_vflip(True) #图像垂直反转
sensor.skip_frames(time = 2000)
sensor.set_auto_gain(False) # must be turned off for color tracking
sensor.set_auto_whitebal(False) # must be turned off for color tracking

tv.init(triple_buffer=True) # Initialize the         tv.TV初始化
clock = time.clock()
"""

"""
Y1 =Y2 = 0 # 第一次阈值
Y3 =Y4 = 0 # 第2次阈值
Y5 =Y6 =Y7 =Y8 = 0 # 第3次4次阈值
HD0=HD1=HD2=HD3=HD4=HD5=HD6=HD7=HD8=HD9=HD10=HD11=HD12=HD13=HD14=HD15=HD16=HD17=HD18=HD19=HD20=0
HD21=HD22=HD23=HD24=HD25=HD26=HD27=HD28=HD29=HD30=HD31=HD32=HD33=HD34=HD35=HD36=HD37=HD38=HD39=HD40=0

HD45=HD46=HD47=HD50=HD51=HD52=HD53=HD54=HD55=HD56=HD57=HD58=HD59=HD60=0
HD41=HD42=0
HD43=HD44=HD48=HD49=300 #第一次、第二次roi大小
HD200=HD201=HD223=HD224=HD225=HD226=HD227=HD228=HD229=0 # 第二次总高总宽计算
B5=0
B1=B2=B3=B4=B6=B7=B8=B9=B10=B11=B12=B13=B14=B15=B16=B17=B18=B19=B20=B21=B22=B23=B24=B25=B26=B27=B28=B29=B30=B31=B32=B33=B34 =0
while(True): # 一个死循环
    clock.tick()
    #sensor.set_windowing(0,0,479,362)
    i=i2=0 # 定义变量i,大色块个数
    #image.draw_string(30, 10,Y2)# 屏幕写字

    #print('HD41  %s'%HD41)

    if HD50 == 1:  #第一开关 PLC-D249

        B1=B2=B3=B4=B5=B6=B7=B8=0
        thresholds = (Y1, Y2)#第一次查找阈值
        #image.draw_string(0, 10, Y1)
        img = sensor.snapshot()

        for blob in img.find_blobs([thresholds],roi = [HD41,HD42,HD43,HD44], pixels_threshold=10, area_threshold=10, merge=True):#pixels像素个数阈值,area返回色块边框面积阈值(w * h),merge=True多种颜色时显示一个框框
            #print('HD41  %s'%HD41)#, merge=True

            if blob.elongation() > 0.8:
                #img.draw_edges(blob.min_corners(), color=255)# 返回的角列表之间绘制线边
                #img.draw_line(blob.major_axis_line(), color=153)# 返回blob的主轴(这条线穿过最小面积矩形的最长边)的行元组(x1, y1, x2, y2),可以使用 image.draw_line() 来绘制它。
                #img.draw_line(blob.minor_axis_line(), color=0)#返回blob的次轴(这条线穿过最小面积矩形的最短边)的行元组(x1, y1, x2, y2),可以使用 image.draw_line() 来绘制它。
                print('I长比 %s'%blob.elongation)
            i=i+1 # 每个色块加1
            # These values are stable all the time.
            img.draw_rectangle(blob.rect(), color=255, thickness = 5)# 在图像上绘制一个矩形。 您可以单独传递x,y,w,h或作为元组(x,y,w,h)传递。

            #B7=blob[0]+1 # 框框加宽显示-多写3行
            #B8=blob[1]+1
            #img.draw_rectangle(B7,B8,blob[2],blob[3], color=255, thickness = 50)# 在图像上绘制ROI区域,起点,长宽  #tchikness像素宽度
            img.draw_cross(blob.cx(), blob.cy(), color=227,thickness = 5)# 在图像上绘制一个十字 #tchikness像素宽度
            # Note - the blob rotation is unique to 0-180 only.
            #img.draw_keypoints([(blob.cx(), blob.cy(), int(math.degrees(blob.rotation())))], size=40, color=1)
            #绘制圆,size 控制特征点的大小,将 fill 设置为True以填充特征点,
            #print('X坐标%s'%blob.cx())#逐个打印色块中心坐标
            #print('Y坐标%s'%blob.cy())#
            #print('框高%s'%blob.h())#打印刀头高度


            B1 = blob.h()#色块总高度B2
            B2 = B1+B2
            B3 = blob.w()#色块总宽度B4
            B4 = B3+B4

        img.draw_rectangle(HD41,HD42,HD43,HD44, color=255, thickness = 5)# 在图像上绘制ROI区域,起点,长宽  #thickness像素宽度


        img.draw_line(20,50, 21, 51, thickness = 3)# 画白线,2像素宽度


        img.draw_string(0, 40,str(i),scale=8)# 屏幕写字 #scale放大缩小
        img.draw_string(0, 1120,str(B9),scale=8)# 屏幕写字 #scale放大缩小
        tv.display(img,x_scale=0.221,y_scale=0.196) # 图像传输#,x_scale=0.5,y_scale=0.5缩放输出
            # VGA640*480(缩放0.55,0.49)  #XGA1024*768(缩放0.35,0.31)  #UXGA1600*1200(缩放0.221,0.196)
        #time.sleep_ms(100) #  延时
        print('数量i  %s'%i)#打印数量
        print('B2  %s'%B2)#色块总高度B2
        print('B4  %s'%B4)#色块总宽度B4

        HD0 = B2 #第一次总高总宽暂存
        HD1 = B4
        if HD7 == 1:  #标定开关
            HD8 = B2 #第一次总高度另存为
            HD9 = B4 #第一次总宽度另存为

        if B2 == HD44:  #检测区域 全黑全白 无特征输出0
            B2 = 0 #第
        if B4 == HD43:  #检测区域 全黑全白 无特征输出0
            B4 = 0

        HD3 = HD10/100 #PLC设定HD10
        HD4 = HD8*HD3  #总高度B2对比数值
        print('HD4  %s'%HD4)

        if HD0 > HD4:  #判断第一次阈值总高度是否报警
            HD5 = 1
        else:
            HD5 = 0

        HD6 = HD9*HD3  #总宽度B4对比数值
        print('HD6  %s'%HD6)

        if HD1 > HD6:  #判断第一次阈值总宽度是否报警
            HD5 = 1
        else:
            HD5 = 0


    if HD45 == 2:  # 第二开关 PLC-D244                开始第二次...................................................................................
        if B10 == 0:
            B10 = 1
        if B10 == 2:
            B10 = 0
        if B10 == 1: # 轮换显示
            B11=B12=B13=B14=B15=B16=B17=B18=0
            thresholds = (Y3, Y4)#第二次查找阈值
            img = sensor.snapshot()

            for blob in img.find_blobs([thresholds],roi = [HD46,HD47,HD48,HD49], pixels_threshold=50, area_threshold=255,merge=True):#pixels像素个数阈值,area返回色块边框面积阈值(w * h),merge=True多种颜色时显示一个框框
                #print('HD41  %s'%HD41)       ,merge=True         #第二次roi

                if blob.elongation() > 0.5:
                    #img.draw_edges(blob.min_corners(), color=255)# 返回的角列表之间绘制线边
                    #img.draw_line(blob.major_axis_line(), color=153)# 返回blob的主轴(这条线穿过最小面积矩形的最长边)的行元组(x1, y1, x2, y2),可以使用 image.draw_line() 来绘制它。
                    #img.draw_line(blob.minor_axis_line(), color=0)#返回blob的次轴(这条线穿过最小面积矩形的最短边)的行元组(x1, y1, x2, y2),可以使用 image.draw_line() 来绘制它。
                    print('I长比 %s'%blob.elongation)
                i2=i2+1 # i2第二次数量 每个色块加1
                # These values are stable all the time.
                img.draw_rectangle(blob.rect(), color=255,thickness = 5)# 在图像上绘制一个矩形。 您可以单独传递x,y,w,h或作为元组(x,y,w,h)传递。

                #B17=blob[0]+1 # 框框加宽显示-多写3行
                #B18=blob[1]+1
                #img.draw_rectangle(B17,B18,blob[2],blob[3], color=255, tchikness = 2)# 在图像上绘制ROI区域,起点,长宽  #tchikness像素宽度

                img.draw_cross(blob.cx(), blob.cy(), color=227,thickness = 5)# 在图像上绘制一个十字
                # Note - the blob rotation is unique to 0-180 only.
                #img.draw_keypoints([(blob.cx(), blob.cy(), int(math.degrees(blob.rotation())))], size=40, color=1)
                #绘制圆,size 控制特征点的大小,将 fill 设置为True以填充特征点,
                #print('X坐标%s'%blob.cx())#逐个打印色块中心坐标
                #print('Y坐标%s'%blob.cy())#
                #print('框高%s'%blob.h())#打印刀头高度

                B11 = blob.h()#色块总高度B2
                B12 = B11+B12 #累加每个高度值
                B13 = blob.w()#色块总宽度B4
                B14 = B13+B14
            img.draw_rectangle(HD46,HD47,HD48,HD49, color=255,thickness = 5)# 在图像上绘制ROI区域,起点,长宽


            img.draw_string(100, 40,str(i2),scale=8)# 屏幕写字 #scale放大缩小
            img.draw_string(0, 1120,str(B9),scale=8)# 屏幕写字 #scale放大缩小
            tv.display(img,x_scale=0.221,y_scale=0.196) # 图像传输#,x_scale=0.5,y_scale=0.5缩放输出

            print('数量i  %s'%i)#打印数量
            print('B12  %s'%B12)#第二次色块总高度B12
            print('B14  %s'%B14)#     色块总宽度B14


            HD200 = B12 # 总高总宽第二次暂存
            HD201 = B14


            if HD7 == 2:  #2第二次标定开关 PLC-D213
                HD228 = B12 #第二次总高度另存为
                HD229 = B14 #第二次总宽度另存为

            if B12 == HD49:  #检测区域 全黑全白 无特征输出0
                B12 = 0 #第
            if B14 == HD48:  #检测区域 全黑全白 无特征输出0
                B14 = 0


            HD223 = HD11/100 #PLC设定HD11 #第二次相似度的百分比PLC-D210
            HD224 = HD228*HD223  #总高度B2对比数值
            print('HD224  %s'%HD224)

            if HD200 > HD224:  #判断第一次阈值总高度是否报警
                HD5 = 1
            else:
                HD5 = 0

            HD226 = HD229*HD223  #总宽度B4对比数值
            print('HD226  %s'%HD226)

            if HD201 > HD226:  #判断第一次阈值总宽度是否报警
                HD5 = 1
            else:
                HD5 = 0
            B10 = 2 # 轮换显示,牺牲第二次运行频率
    B19 = 0
    while B19 <= 2:
        if modbus.any():# 判断modbus是否来openmv请求了数据
            B19 += 1
            modbus.handle(debug=True) # handle憨豆函数处理modbus数据,包括写与读

            modbus.REGISTER[1] = HD5 #第1次阈值报警PLC-D2            发给plc的指令。。。。
            modbus.REGISTER[2] = B2 #第一次实时总高度PLC-D3
            modbus.REGISTER[3] = B4 #第一次实时总宽度PLC-D4
            if HD7 == 1:  #标定开关  PLC-D213,(1)第一次标定
                modbus.REGISTER[4] = HD8 #第一标定 总高度PLC-D5
                modbus.REGISTER[5] = HD9 #第一标定 总宽度PLC-D6
            if HD7 == 2:  #标定开关  PLC-D213,(2)第二次标定
                modbus.REGISTER[6] = HD228 #第二标定 总高度PLC-D7
                modbus.REGISTER[7] = HD229 #第二标定 总宽度PLC-D8

            modbus.REGISTER[8] = B12 #第二次实时总高度PLC-D9
            modbus.REGISTER[9] = B14 #第二次实时总高度PLC-D10
            modbus.REGISTER[10] += 1 #第二次实时总高度PLC-D11
            if modbus.REGISTER[10]>=100:
                modbus.REGISTER[10] = 1


            modbus.REGISTER[11] = 1

            Y1 = modbus.REGISTER[201] #第1次阈值PLC-D201            接收plc的指令。。。。
            Y2 = modbus.REGISTER[202] #第1次阈值PLC-D202
            Y3 = modbus.REGISTER[203] #第2次阈值PLC-D203
            Y4 = modbus.REGISTER[204] #第2次阈值PLC-D204

            Y5 = modbus.REGISTER[205] #第3次阈值PLC-D205
            Y6 = modbus.REGISTER[206]
            #Y7 = modbus.REGISTER[207] #第4次阈值PLC-D207
            #Y8 = modbus.REGISTER[208]
            HD10 = modbus.REGISTER[209] #第一次相似度的百分比PLC-D209
            HD11 = modbus.REGISTER[210] #第二次相似度的百分比PLC-D210
            #HD12 = modbus.REGISTER[211] #第二次相似度的百分比PLC-D211
            #HD13 = modbus.REGISTER[212] #第二次相似度的百分比PLC-D212
            HD7 = modbus.REGISTER[213] #一次1,二次2 标定开关PLC-D213

            HD45 = modbus.REGISTER[244] #              PLC-D244
            if HD45 >= 1:  #第一次roi开关 PLC-D244
                HD41 = modbus.REGISTER[240] #roi X       PLC-D240  发送0或者未发送数据roi会报错
                HD42 = modbus.REGISTER[241] #roi Y       PLC-D241
                HD43 = modbus.REGISTER[242] #roi 宽      PLC-D242
                HD44 = modbus.REGISTER[243] #roi 高      PLC-D243
            #if HD45 == 2:  #第二次roi开关 PLC-D244
                HD46 = modbus.REGISTER[245] #roi X       PLC-D245  发送0或者未发送数据roi会报错
                HD47 = modbus.REGISTER[246] #roi Y       PLC-D246
                HD48 = modbus.REGISTER[247] #roi 宽      PLC-D247
                HD49 = modbus.REGISTER[248] #roi 高      PLC-D248
            HD50 = modbus.REGISTER[249] # 第一次开关       PLC-D249

            print('HDY2  %s'%Y2)
            print('HD41  %s'%HD41)
            print('HD45  %s'%HD45)
            print(modbus.REGISTER[0:17]) #写0:17,会打印0-16
            print(modbus.REGISTER[200:217]) #写0:17,会打印0-16
            print(modbus.REGISTER[240:250]) #写0:17,会打印0-16
            print('Y1  %s'% Y1)
            print('Y2  %s'% Y2)
        else:
            #time.sleep_ms(20) #  延时,发送到plc
            #modbus.REGISTER[0] = 1100
            #modbus.REGISTER[1] += 1
            print(modbus.REGISTER[0:4])
            # image processing in there


    print('帧率 %s'%clock.fps())# 打印帧率
    B9=clock.fps()
    #print('B9 %s'%B9)# 打印B9