导航

    • 登录
    • 搜索
    • 版块
    • 产品
    • 教程
    • 论坛
    • 淘宝
    1. 主页
    2. go3a
    G
    • 举报资料
    • 资料
    • 关注
    • 粉丝
    • 屏蔽
    • 帖子
    • 楼层
    • 最佳
    • 群组

    go3a

    @go3a

    0
    声望
    3
    楼层
    547
    资料浏览
    0
    粉丝
    1
    关注
    注册时间 最后登录

    go3a 关注

    go3a 发布的帖子

    • 为什么我识别橙红色的时候,把白色也识别出来了?看图中颜色区域为橙红色,而串行终端输出了白色和橙红色,求解答谢谢
      import sensor, image, time , math , pyb
      from pyb import UART
      sensor.reset()
      sensor.set_pixformat(sensor.RGB565)
      sensor.set_framesize(sensor.QVGA)
      sensor.skip_frames(time = 2000)
      sensor.set_auto_gain(False)
      sensor.set_auto_whitebal(False)
      clock = time.clock()
      a1=0
      uart = UART(3, 115200)
      uart.init(115200, bits=8, parity=None, stop=1)
      
      def find_max(blobs):
          max_size=0
          for blob in blobs:
              if blob[2]*blob[3] > max_size:
                  max_blob = blob
                  max_size = blob[2]*blob[3]
          return max_blob
      
      
      red_threshold_01 = ((82, 36, 63, 23, 63, 28));
      white_threshold_01 = ((75, 100, -18, 2, -4, 23));
      pink_threshold_01 = ((48, 100, 5, 127, -25, 12));
      
      
      while(True):
          clock.tick()
          img = sensor.snapshot().lens_corr(1.8)
          blobs = img.find_blobs([red_threshold_01], pixels_threshold=150, area_threshold=500, merge=True, margin=10);
      
          if blobs:
          #如果找到了目标颜色
              print("ored")
              max_blob_0 = find_max(blobs)
              for b in blobs:
                  x = b[0]
                  y = b[1]
                  width = b[2]
                  height = b[3]
      
                  img.draw_rectangle(max_blob_0.rect())
                  #用矩形标记出目标颜色区域
                  img.draw_cross(max_blob_0.cx(), max_blob_0.cy())
                  #在目标颜色区域的中心画十字形标记
                  print(b[5],b[6],b[7])
                  X =int(max_blob_0.cx()-img.width()/2)
                  Y =int(max_blob_0.cy()-img.height()/2)
      
          blobs = img.find_blobs([white_threshold_01], pixels_threshold=100, area_threshold=200, merge=True, margin=10);
          if blobs:
      
              print("white")
              max_blob_1 = find_max(blobs)
              img.draw_rectangle(max_blob_1.rect())
                  #用矩形标记出目标颜色区域
              img.draw_cross(max_blob_1.cx(), max_blob_1.cy())
              print("cx: ", max_blob_1.cx())             #打印X的的位置
              print("cy: ", max_blob_1.cy())


          blobs = img.find_blobs([pink_threshold_01], pixels_threshold=100, area_threshold=100, merge=True, margin=10);
          if blobs:
              max_blob_2 = find_max(blobs)
              img.draw_rectangle(max_blob_2.rect(),color = (255, 0, 0))
                  #用矩形标记出目标颜色区域
              img.draw_cross(max_blob_2.cx(), max_blob_2.cy())
              print("pink cx: cy: ", max_blob_2.cx(),max_blob_2.cy())             #打印X的的位置


      0_1666007733147_e70e46a4-6075-47ed-a2ee-749111d53338-image.png

      发布在 OpenMV Cam
      G
      go3a
    • 为什么在识别的时候帧率一直下降,还一卡一卡的,求解答,谢谢各位!
      import sensor, image, time , math , pyb
      from pyb import UART
      sensor.reset()
      sensor.set_pixformat(sensor.RGB565)
      sensor.set_framesize(sensor.QVGA)
      sensor.skip_frames(time = 2000)
      sensor.set_auto_gain(False)
      sensor.set_auto_whitebal(False)
      clock = time.clock()
      a1=0
      uart = UART(3, 115200)
      uart.init(115200, bits=8, parity=None, stop=1)
      
      def find_max(blobs):
          max_size=0
          for blob in blobs:
              if blob[2]*blob[3] > max_size:
                  max_blob = blob
                  max_size = blob[2]*blob[3]
          return max_blob
      
      
      red_threshold_01 = ((20, 58, 49, 127, -128, 127));
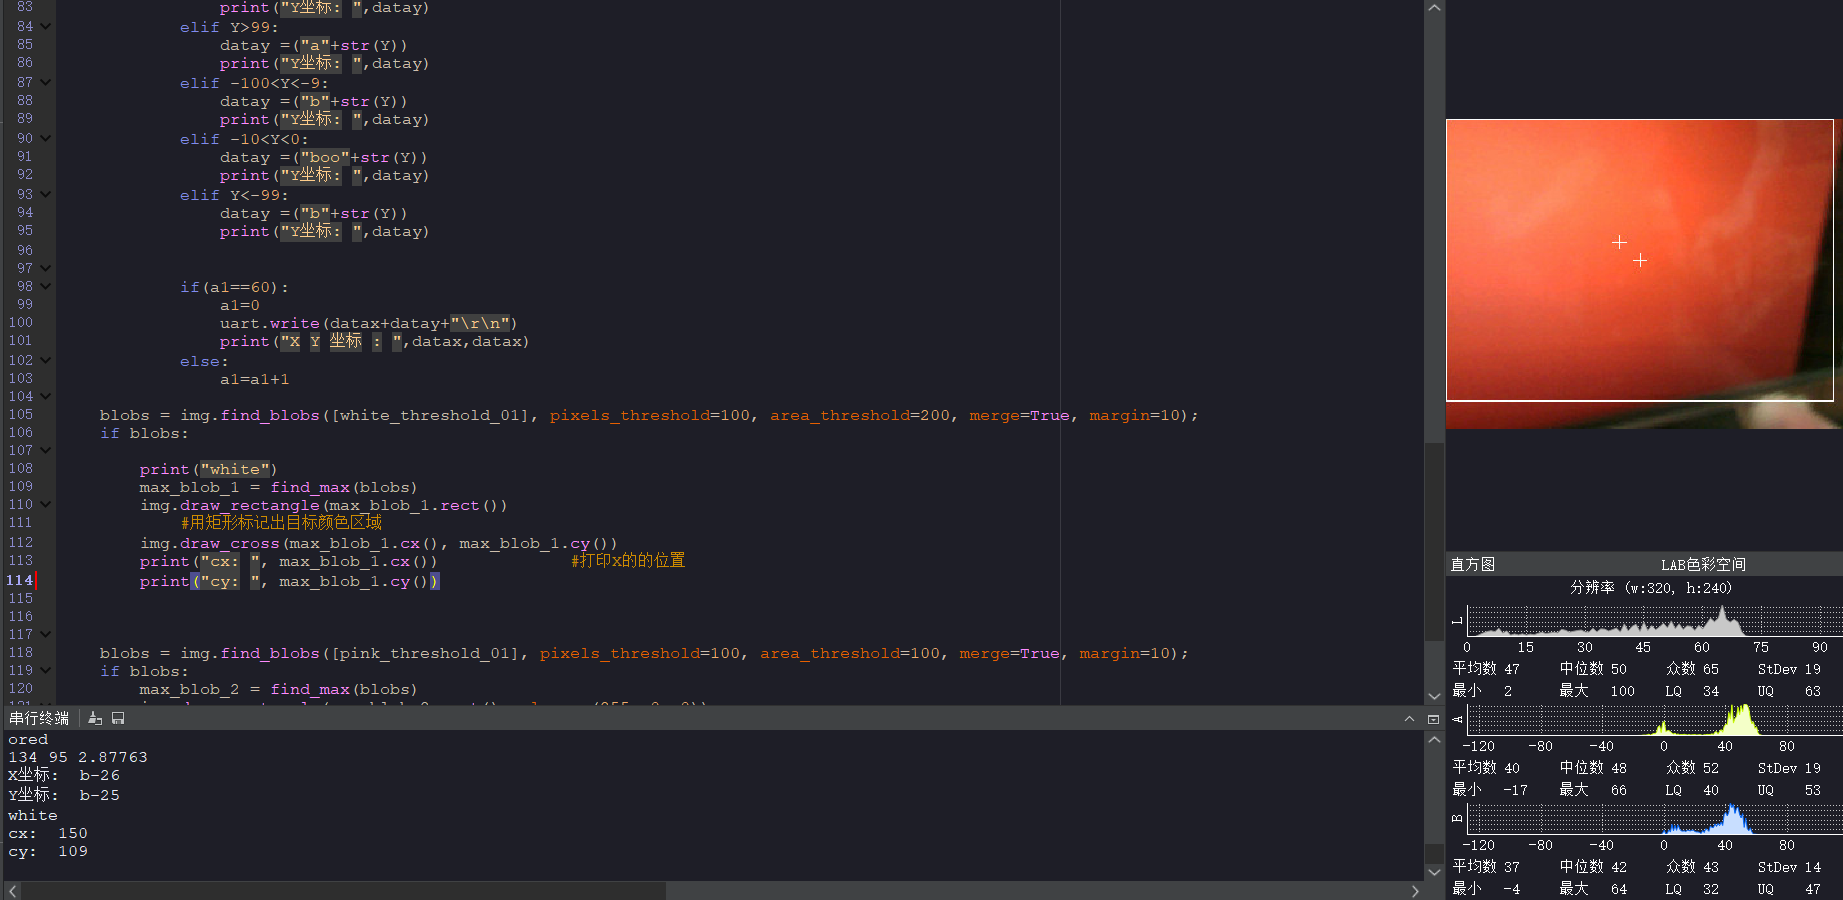
      white_threshold_01 = ((75, 100, 96, -24, 31, -7));
      pink_threshold_01 = ((30, 100, 5, 73, -42, 32));
      
      
      while(True):
          clock.tick()
          img = sensor.snapshot().lens_corr(1.8)
          blobs = img.find_blobs([red_threshold_01], roi=[0,0,200,200],pixels_threshold=150, area_threshold=500, merge=True, margin=10);
          blobs1 = img.find_blobs([white_threshold_01], pixels_threshold=100, area_threshold=100, merge=True, margin=10);
          if blobs:
          #如果找到了目标颜色
              print("ored")
              for b in blobs:
              #迭代找到的目标颜色区
                  x = b[0]
                  y = b[1]
                  width = b[2]
                  height = b[3]
                      # Draw a rect around the blob.
                  img.draw_rectangle([x,y,width,height]) # rec
                  img.draw_cross(b[5], b[6]) # cx, cy
                  #在目标颜色区域的中心画十字形标记
                  print(b[5],b[6],b[7])
                  X =int(b[5]-img.width()/2)
                  Y =int(b[6]-img.height()/2)
                  if 9<X<100:
                      datax =("ao"+str(X))
                      print("X坐标: ",datax)
                  elif 0<X<10:
                      datax =("aoo"+str(X))
                      print("X坐标: ",datax)
                  elif X==0:
                      datax =("aooo")
                      print("X坐标: ",datax)
                  elif X>99:
                      datax =("a"+str(X))
                      print("X坐标: ",datax)
                  elif -100<X<-9:
                      datax =("b"+str(X))
                      print("X坐标: ",datax)
                  elif -10<X<0:
                      datax =("boo"+str(X))
                      print("X坐标: ",datax)
                  elif X<-99:
                      datax =("b"+str(X))
                      print("X坐标: ",datax)
      
                  if 9<Y<100:
                      datay =("ao"+str(Y))
                      print("Y坐标: ",datay)
                  elif 0<Y<10:
                      datay =("aoo"+str(Y))
                      print("Y坐标: ",datay)
                  elif Y==0:
                      datay =("aooo")
                      print("Y坐标: ",datay)
                  elif Y>99:
                      datay =("a"+str(Y))
                      print("Y坐标: ",datay)
                  elif -100<Y<-9:
                      datay =("b"+str(Y))
                      print("Y坐标: ",datay)
                  elif -10<Y<0:
                      datay =("boo"+str(Y))
                      print("Y坐标: ",datay)
                  elif Y<-99:
                      datay =("b"+str(Y))
                      print("Y坐标: ",datay)
      
      
                  if(a1==60):
                      a1=0
                      uart.write(datax+datay+"\r\n")
                      print("X Y 坐标 : ",datax,datax)
                  else:
                      a1=a1+1


          for c in img.find_circles(threshold = 3500, x_margin = 10, y_margin = 10, r_margin = 10,
                  r_min = 2, r_max = 100, r_step = 2):
              area = (c.x()-c.r(), c.y()-c.r(), 2*c.r(), 2*c.r())
              statistics = img.get_statistics(roi=area)
              #像素颜色统计
      
              if 75<statistics.l_mode()<100 and -27<statistics.a_mode()<96 and -7<statistics.b_mode()<31:
                  img.draw_circle(c.x(), c.y(), c.r(), color = (255, 0, 0))
                  #识别到的白色圆形用红色的圆框出来
                  print("白",c.x(),c.y())
      
      
          for c in img.find_circles(threshold = 3500, x_margin = 10, y_margin = 10, r_margin = 10,
                  r_min = 2, r_max = 100, r_step = 2):
              area = (c.x()-c.r(), c.y()-c.r(), 2*c.r(), 2*c.r())
              statistics = img.get_statistics(roi=area)
              #像素颜色统计
              print(statistics)
              if 30<statistics.l_mode()<100 and 5<statistics.a_mode()<73 and -42<statistics.b_mode()<32:
                  img.draw_circle(c.x(), c.y(), c.r(), color = (255, 0, 0))
                  #识别到的粉色圆形用红色的圆框出来
                  print("粉",c.x(),c.y())
      
      发布在 OpenMV Cam
      G
      go3a