@kidswong999 好的明白了,蟹蟹小小智~
M
Musk
@Musk
1
声望
37
楼层
1881
资料浏览
0
粉丝
0
关注
Musk 发布的帖子
-
IDE视图与实际尺寸1:1发布在 OpenMV Cam
识别色块并发送色块的中心坐标,但之后发现这个坐标与色块在实际所处平面当中的位置参数仍存在误差,譬如我现在使用的标定棋谱每格子长为35mm,当我置于如图所示时,坐标应为(70,70),但实际测得(52,52),所以我在b[5],b[6]前乘了比例系数——>1.35b[5],1.35b[6]
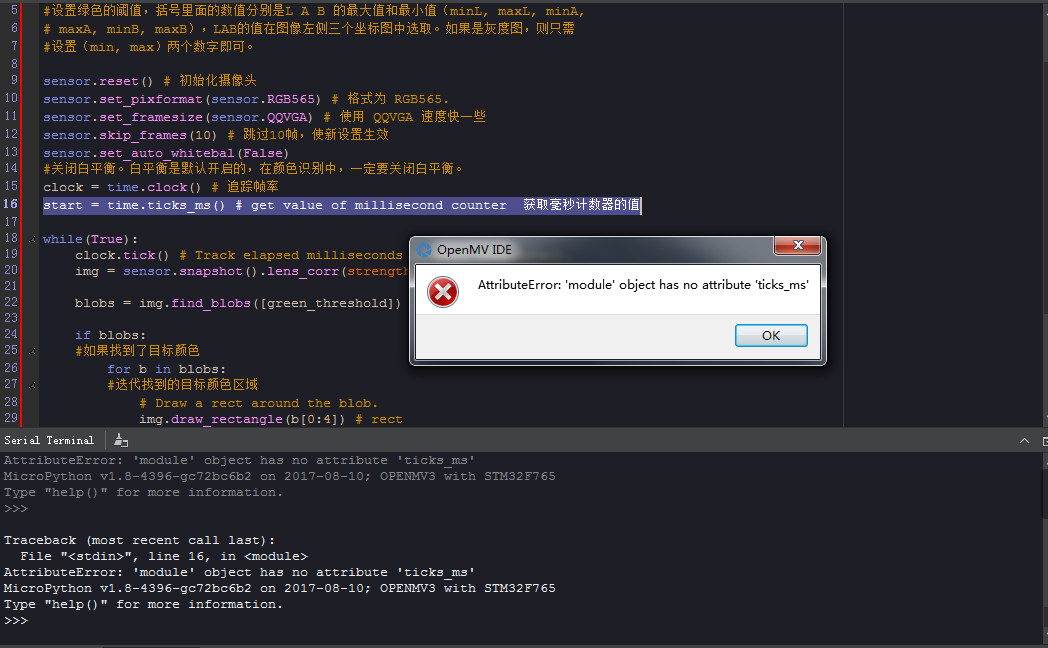
【问题:除此以外还有什么方法可直接把IDE视图和打印出的来参数与实际尺寸无限趋近于相等吗?】@kidswong999 @yuanimport sensor, image, time import pyb from pyb import UART # 颜色追踪的例子,一定要控制环境的光,保持光线是稳定的。 green_threshold = (18, 100, -128, -20, -128, 127) #设置绿色的阈值,括号里面的数值分别是L A B 的最大值和最小值(minL, maxL, minA, # maxA, minB, maxB),LAB的值在图像左侧三个坐标图中选取。如果是灰度图,则只需 #设置(min, max)两个数字即可。 sensor.reset() # 初始化摄像头 sensor.set_pixformat(sensor.RGB565) # 格式为 RGB565. sensor.set_framesize(sensor.QQVGA) # 使用 QQVGA 速度快一些 sensor.skip_frames(10) # 跳过10帧,使新设置生效 sensor.set_auto_whitebal(False) #关闭白平衡。白平衡是默认开启的,在颜色识别中,一定要关闭白平衡。 clock = time.clock() # 追踪帧率 start = pyb.millis() # get value of millisecond counter 获取毫秒计数器的值 while(True): clock.tick() # Track elapsed milliseconds between snapshots(). img = sensor.snapshot().lens_corr(strength = 1.7, zoom = 1.0) uart = UART(3, 19200) blobs = img.find_blobs([green_threshold]) if blobs: #如果找到了目标颜色 for b in blobs: # print(pyb.millis()) #迭代找到的目标颜色区域 # Draw a rect around the blob. img.draw_rectangle(b[0:4]) # rect #用矩形标记出目标颜色区域 img.draw_cross(b[5], b[6]) # cx, cy #在目标颜色区域的中心画十字形标记 delta = pyb.elapsed_millis(start)#计算间隔时间 if delta > 2000: start = pyb.millis() # 更新时间 # output_str=(b[5],b[6]) output_str="@%d.%d#" % (1.35*b[5],1.35*b[6]) print(output_str) uart.write(output_str) -
RE: 边缘提取之后可以有什么操作发布在 OpenMV Cam
@kidswong999 @yuan
如果说利用快速边缘检测,是否可以实现抠出并用矩阵和十字确认画面当中的目标物的轮廓,比如球或其他形状的物体?

-
每时间间隔后获取色块当下时间的中心坐标发布在 OpenMV Cam
如果直接在条件语句后面添加延时函数的话,发现坐标是会根据延时参数延迟相应时间,不过视图图像也会跟着卡顿延迟,问,有什么法子,可实现视图呈现实时动态,而坐标打印却是保持有时间间隔的呢?
@kidswong999import sensor, image, time # 颜色追踪的例子,一定要控制环境的光,保持光线是稳定的。 green_threshold = (57, 100, -128, -32, -128, 127) #设置绿色的阈值,括号里面的数值分别是L A B 的最大值和最小值(minL, maxL, minA, # maxA, minB, maxB),LAB的值在图像左侧三个坐标图中选取。如果是灰度图,则只需 #设置(min, max)两个数字即可。 sensor.reset() # 初始化摄像头 sensor.set_pixformat(sensor.RGB565) # 格式为 RGB565. sensor.set_framesize(sensor.QQVGA) # 使用 QQVGA 速度快一些 sensor.skip_frames(10) # 跳过10帧,使新设置生效 sensor.set_auto_whitebal(False) #关闭白平衡。白平衡是默认开启的,在颜色识别中,一定要关闭白平衡。 clock = time.clock() # 追踪帧率 while(True): clock.tick() # Track elapsed milliseconds between snapshots(). img = sensor.snapshot().lens_corr(strength = 1.7, zoom = 1.0) blobs = img.find_blobs([green_threshold]) if blobs: #如果找到了目标颜色 for b in blobs: #迭代找到的目标颜色区域 # Draw a rect around the blob. img.draw_rectangle(b[0:4]) # rect #用矩形标记出目标颜色区域 img.draw_cross(b[5], b[6]) # cx, cy #在目标颜色区域的中心画十字形标记 # output_str="[%d,%d]" % (find_blobs.cx(),find_blobs.cy()) #方式1 # print(clock.fps()) # 注意: 你的OpenMV连到电脑后帧率大概为原来的一半 print("(x,y)=",(b[5],b[6])) time.sleep(1500) -
RE: 论其它算法视图如何无痛痒地置于畸变校正后的图像中发布在 OpenMV Cam
@kidswong999
emmmm......整体而言代码是不多,不过譬如畸变校正参数确定后,这个调用函数以及相关定义函数都可像个模块一样,不用再在新的算法代码当中重新进行删改添加定义什么的,就好比植入头文件了那种感觉。 -
论其它算法视图如何无痛痒地置于畸变校正后的图像中发布在 OpenMV Cam
发现比如寻找最大色块例程的视图是存在明显畸变的,所以就将把寻找最大色块的代码与畸变校正代码做了结合,欲实现校正后的画面里寻找到最大色块并较为准确的发送其中心坐标的目的。
代码如下:
# Blob Detection and uart transport
import sensor, image, time
from pyb import UART
import json
# For color tracking to work really well you should ideally be in a very, very,
# very, controlled enviroment where the lighting is constant...
green_threshold   = (25, 100, -69, -10, -72, 127)
# You may need to tweak the above settings for tracking green things...
# Select an area in the Framebuffer to copy the color settings.
sensor.reset()
sensor.set_pixformat(sensor.RGB565)
#sensor.set_framesize(sensor.QVGA)
sensor.skip_frames(time = 2000)
#sensor.set_pixformat(sensor.RGB565) # use RGB565.
sensor.set_framesize(sensor.QQVGA) # use QQVGA for speed.
#sensor.skip_frames(10) # Let new settings take affect.
sensor.set_auto_whitebal(False) # turn this off.
clock = time.clock() # Tracks FPS.

uart = UART(3, 115200)
def find_max(blobs):
    max_size=0
    for blob in blobs:
        if blob.pixels() > max_size:
            max_blob=blob
            max_size = blob.pixels()
    return max_blob

while(True):
    clock.tick()

    img = sensor.snapshot().lens_corr(strength = 1.7, zoom = 1.0)
 #  img = sensor.snapshot() # Take a picture and return the image.

    print(clock.fps())

    blobs = img.find_blobs([green_threshold])
    if blobs:
        max_blob=find_max(blobs)
        print('sum :', len(blobs))
        img.draw_rectangle(max_blob.rect())
        img.draw_cross(max_blob.cx(), max_blob.cy())

        output_str="[%d,%d]" % (max_blob.cx(),max_blob.cy()) #方式1
        #output_str=json.dumps([max_blob.cx(),max_blob.cy()]) #方式2
        print('you send:',output_str)
        uart.write(output_str+'\r\n')
    else:
        print('not found!')
代码做以上结合以后,畸变视图得以校正,色块也得以识别并打印中心坐标。
但,还是觉得麻烦。。。
问题来了:
【其它算法视图如何无痛痒且方便地置于畸变校正后的图像中?】
@kidswong999 @yuan
